Readership demographics have not changed significantly since
2010, aside from a slight shift towards industry (~58% today vs 51% in 2010).
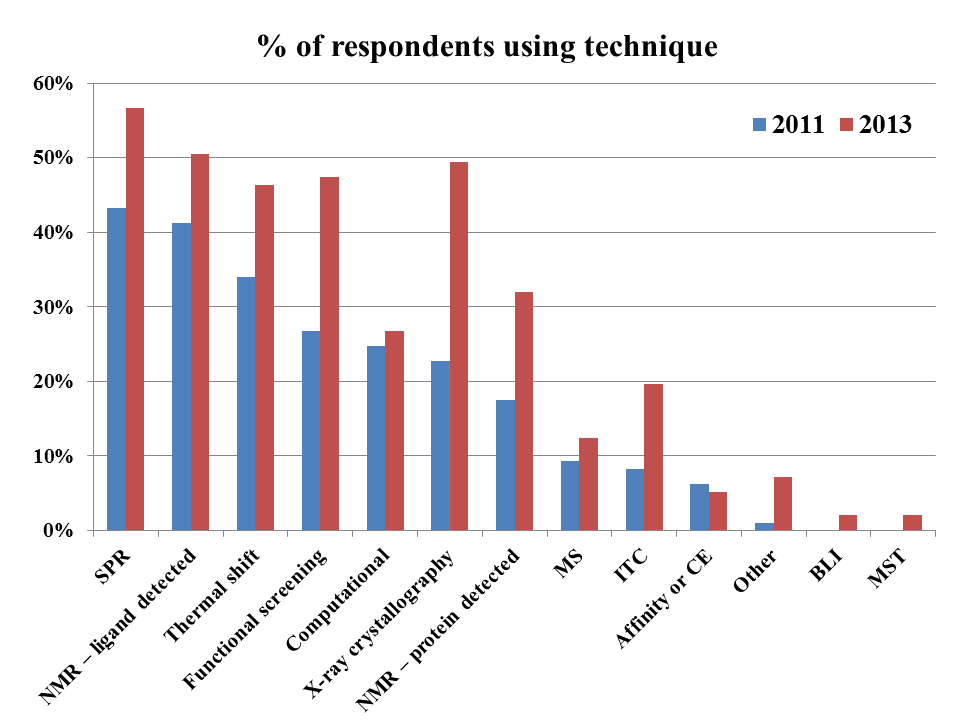
The next question asked about screening methods, and here
things get more interesting.
The overall order of popularity doesn’t seem to have changed
much, the major exception being X-ray crystallography, which is way up. However,
this may be an artifact; a comment on the 2011 poll suggested that some voters
interpreted the question to be about primary screening methods, as
opposed to all methods.
(Technical disclosure: feel free to skip this paragraph
unless you’re a data geek. Due to issues with polling in Blogger, this year’s
poll was run in Polldaddy, the free version of which gave total votes for this question but not the
number of individual respondents. However,
since the two other questions in the poll allowed only single answers, the
number of responses was equal to the number of respondents: 95 for the
demographic question and 97 for the library question below. I thus assumed 97
respondents for this question, which is coincidentally identical to the number in 2011. Note also that the categories BLI and MST were new for 2013.)
Finally, the question on fragment library size shows that
most folks are using libraries of 1000-2000 fragments, with only ~10% of
respondents using very small (≤500) or very large (≥5000) collections of
fragments.
This result is strikingly similar to the median of 1300
fragments that Jamie Simpson, Martin Scanlon, and colleagues found in an
analysis of 22 published libraries. Teddy’s notes from FBLD 2012 put the median
slightly higher: around 2500 for 17 libraries. Perhaps people with larger
libraries tend to broadcast their size? Of course, in the end, it’s not the
size of your library that matters; it’s what’s in it, and what you do with it.
Thanks again for participating, and if you have ideas for
new polls, please let us know.


No comments:
Post a Comment